< Previous Article Next Article >
Using the Debugger
Most developers are familiar with client-side JavaScript debugging using Chrome Developer Tools or similar utilities in other browsers. Profound.js Spaces makes debugging your server-side Node.js code just as simple.
This document walks you through the process.
Starting Debug
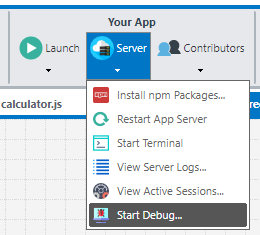
Before you can debug server-side code, your Node.js server must be started for debugging. Simply select the Start Debug... option on the Server menu.
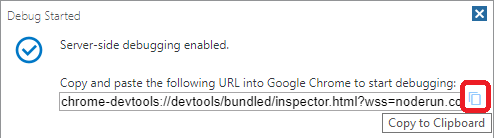
Next, click the icon to copy the debug URL to the clipboard:
Important: While debug is active, anyone with the debug URL can attach to the debug service for your workspace. Anyone attached to the debug service can view all of the workspace's source code, halt code execution, view data in the workspace process's memory, and change code execution. Make sure not to expose the debug URL or to use the debugger from a shared computer. Also when finished debugging, make sure to disable debug by using the option Server -> Restart App Server from the menu in the IDE.
Opening the Debugger
To open the debugger, follow these steps:
- Start a new browser tab in Google Chrome.
- Paste the URL you copied in the previous step into the browser's address bar and press enter.
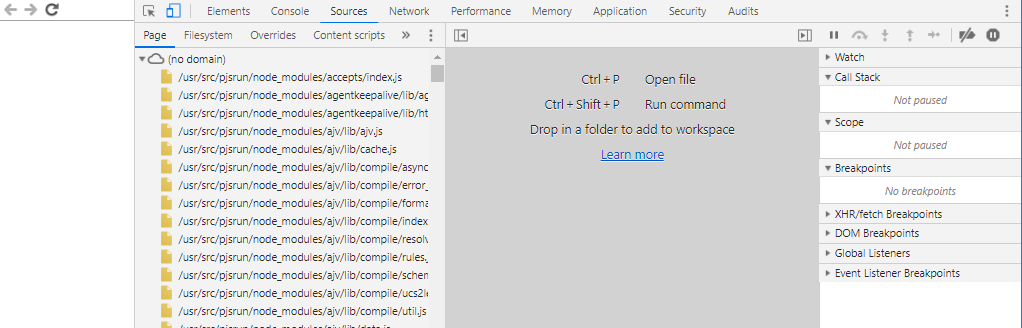
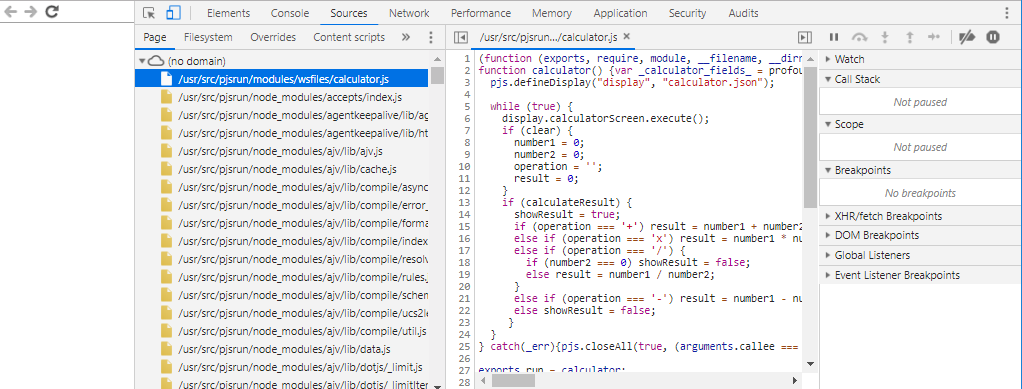
- Navigate to the Sources tab and select the Page tab below it, then expand the tree to see JavaScript files.
Launching your Application
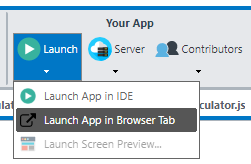
Next, go back to the IDE browser tab and launch your application.
Once the application is launched and your server-side code is triggered, your Node.js file(s) will be loaded and shown at the top of the tree in the Debugger tab. Select the file you would like to debug and your Node.js source code will appear.
Setting Breakpoints
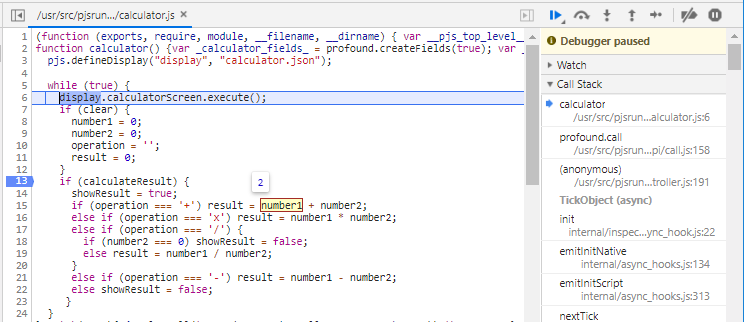
You can now set breakpoints by clicking on the line numbers. Alternatively, you can place the debugger; keyword in your code to initiate a breakpoint.
You may switch back and forth between the Debugger tab and the application. Once a breakpoint is hit, you can start stepping through the code, evaluating variables, and more!
Questions?
Have questions about this topic? Ask for help on our Profound.js Spaces Discussion Forum.